Do you trust your -80 freezer? I got tired of wondering when mine would fail, so I built a temperature sensor that emails me when there’s trouble. I made an R Shiny app to go along with it for easy visualization of freezer temperatures from any device. Here’s how!
Part list
| Part | Cost | Note |
|---|---|---|
| Raspberry Pi Zero W | $14.00 | With pre-soldered header |
| Thermocouple | $12.00 | 24-gauge Type T |
| Adafruit MAX31856 | $17.50 | Thermocouple amplifier breakout board |
| MAX7219 LED matrix display | $9.00 | HiLetgo, many similar options |
| USB wall charger | $3.25 | |
| USB cable | $3.30 | |
| Micro SD card | $5.00 | |
| Total | $64.05 |
Preparing the Raspberry Pi
I used a Raspberry Pi Zero W for this build, but any of the Raspberry Pi single-board computers should work fine. We’ll run it headless, so set up the Pi by installing Raspberry Pi OS on an SD card, enabling ssh, and configuring your network. I wrote about these steps in more detail, including connecting to the troublesome WiFi at University of Arizona, in this blog post.
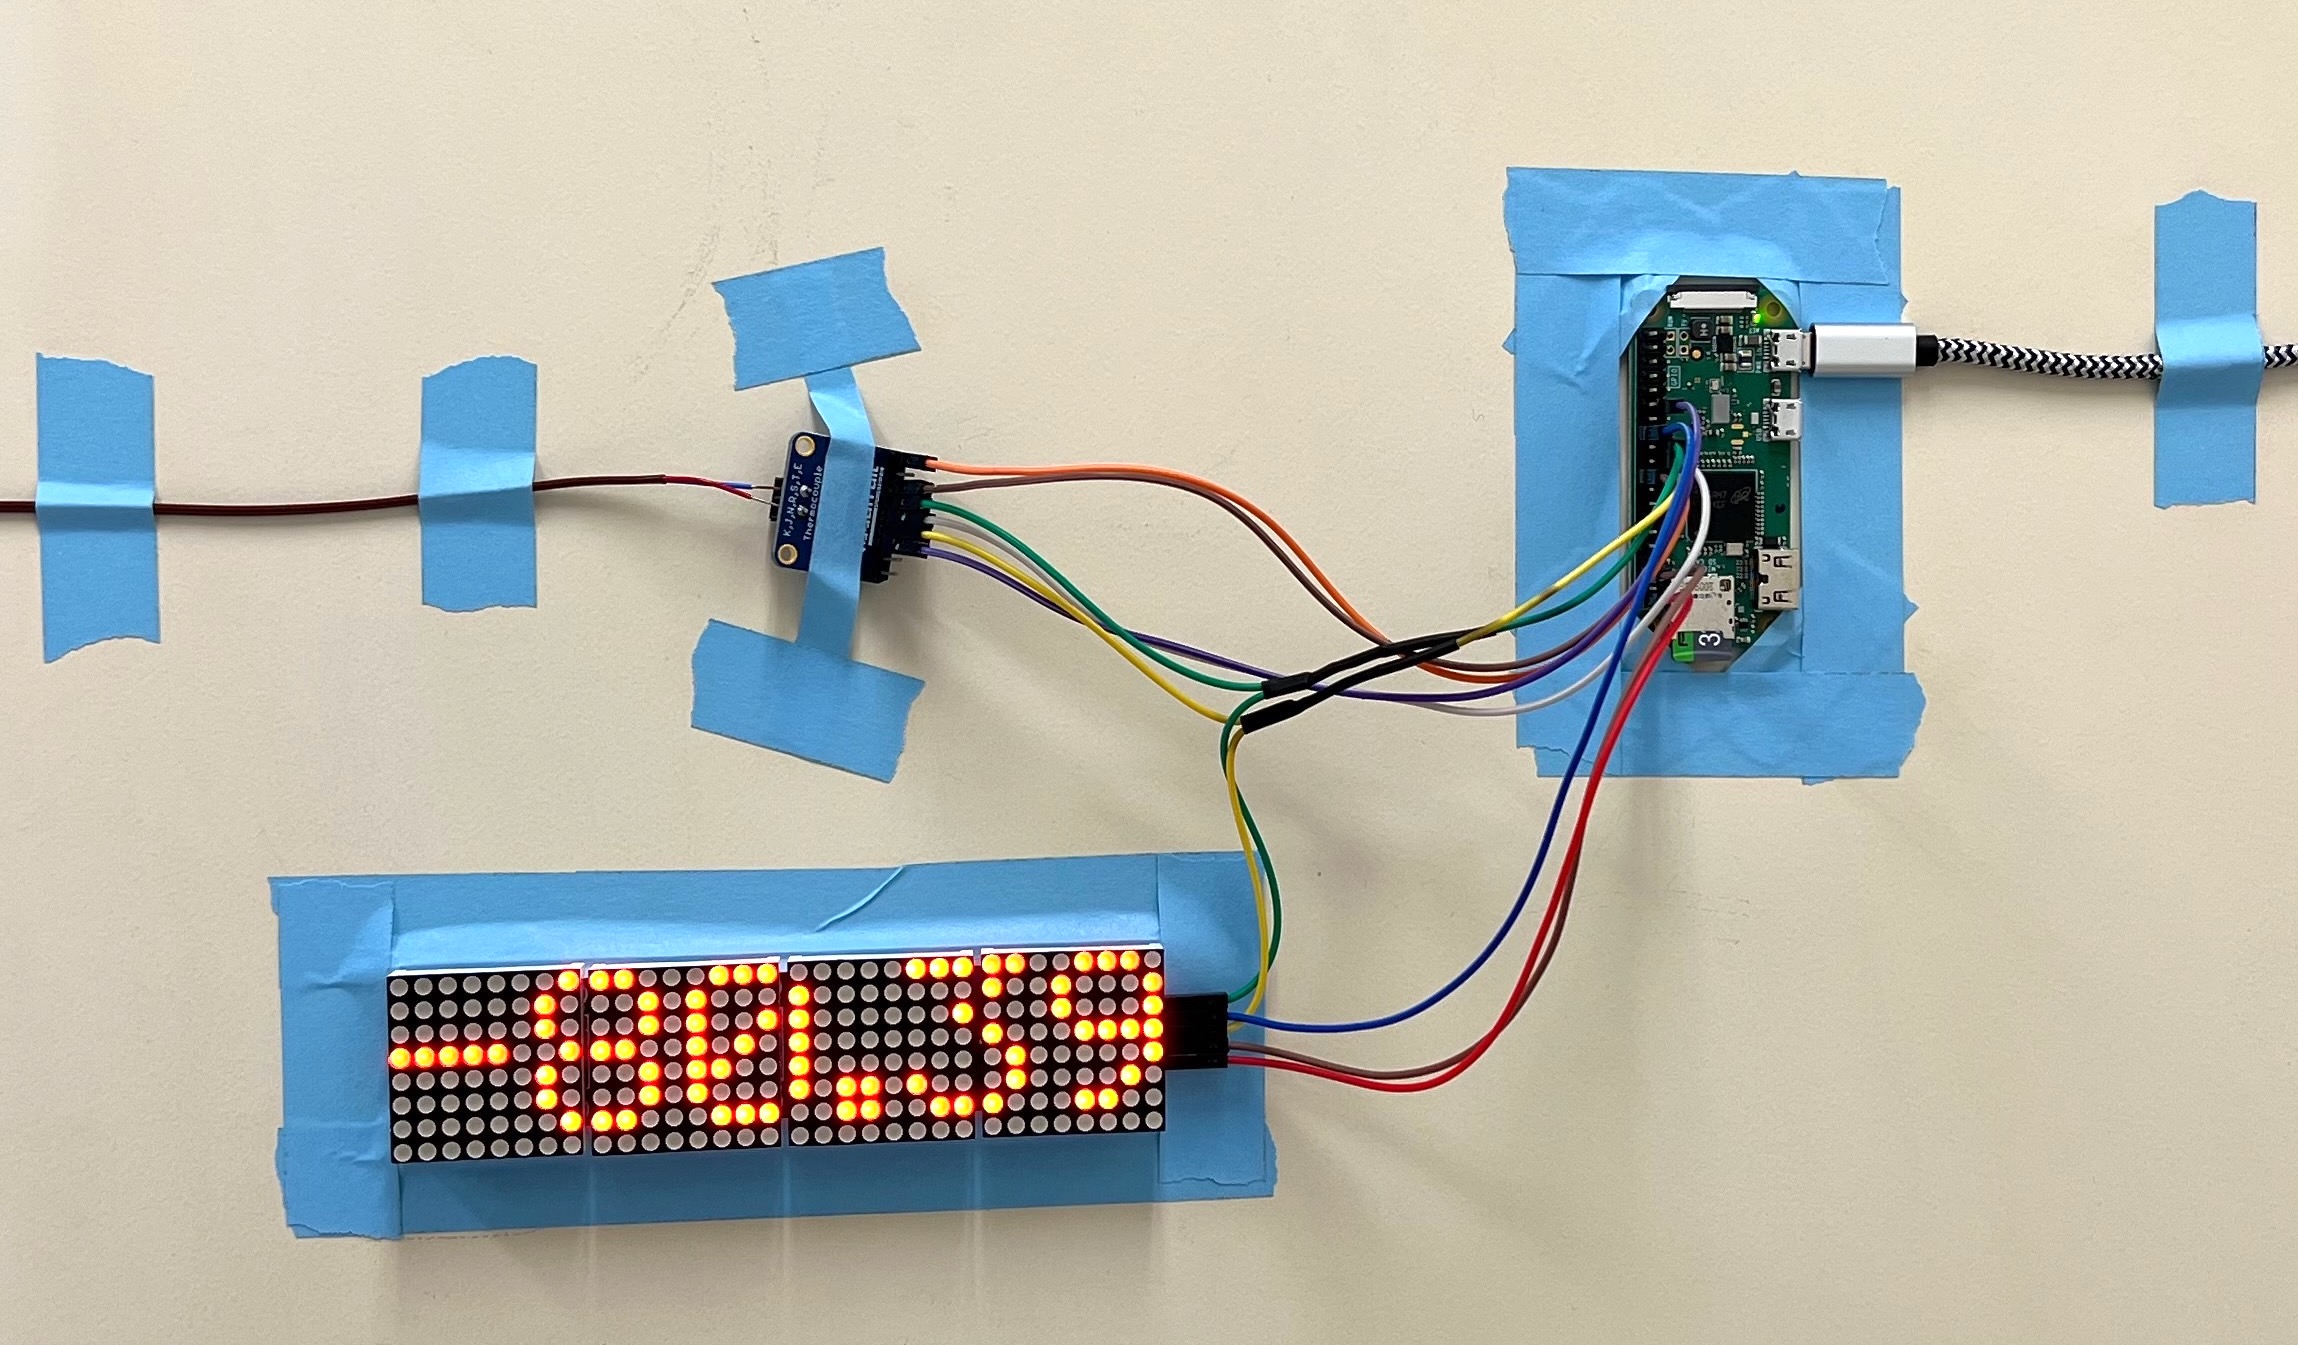
Thermocouple and display
At the heart of this system is a Type T thermocouple driven by an Adafruit MAX31856 thermocouple amplifier breakout board. Thermocouples come in lots of different types, but a Type T is commonly used for this application because of its ability to measure low temperatures and resist moisture. For this project, I used an SLE Type T, which should have an accuracy of 0.5°C or 0.4%, whichever is greater. This is a little more accurate than the more common Type K, but a Type K would also work fine. The Adafruit MAX31856 breakout board can drive several types of thermocouples; if you go with a Type K, you can use the slightly cheaper MAX31855K breakout board.
While it’s not necessary for the alarm system, having a display on the freezer that shows the current temperature is fun and can be a useful backup to the freezer’s own display. I used an LED matrix driven by a MAX7219 breakout board. These little displays are ubiquitous. They’re bright, modular, and easy to control.
SPI
Both the thermocouple and the display use the Serial Peripheral Interface (SPI) to connect to the Raspberry Pi. You can read more about SPI here. By default, Raspberry Pi supports two SPI devices (more can be enabled with software). The devices share most of the SPI pins, but have one chip select (CS) pin per device. This pin allows the Pi to designate which device is sending/receiving data. Fortunately all the specifics of the SPI protocol are handled for us by the Pi’s software. To use SPI devices, you must enable the SPI0 interface using the system config. Start by entering this command:
sudo raspi-config
Next, navigate through the config menus to Interfacing Options and then SPI. Click Yes when asked to enable the SPI interface, then reboot the Pi.
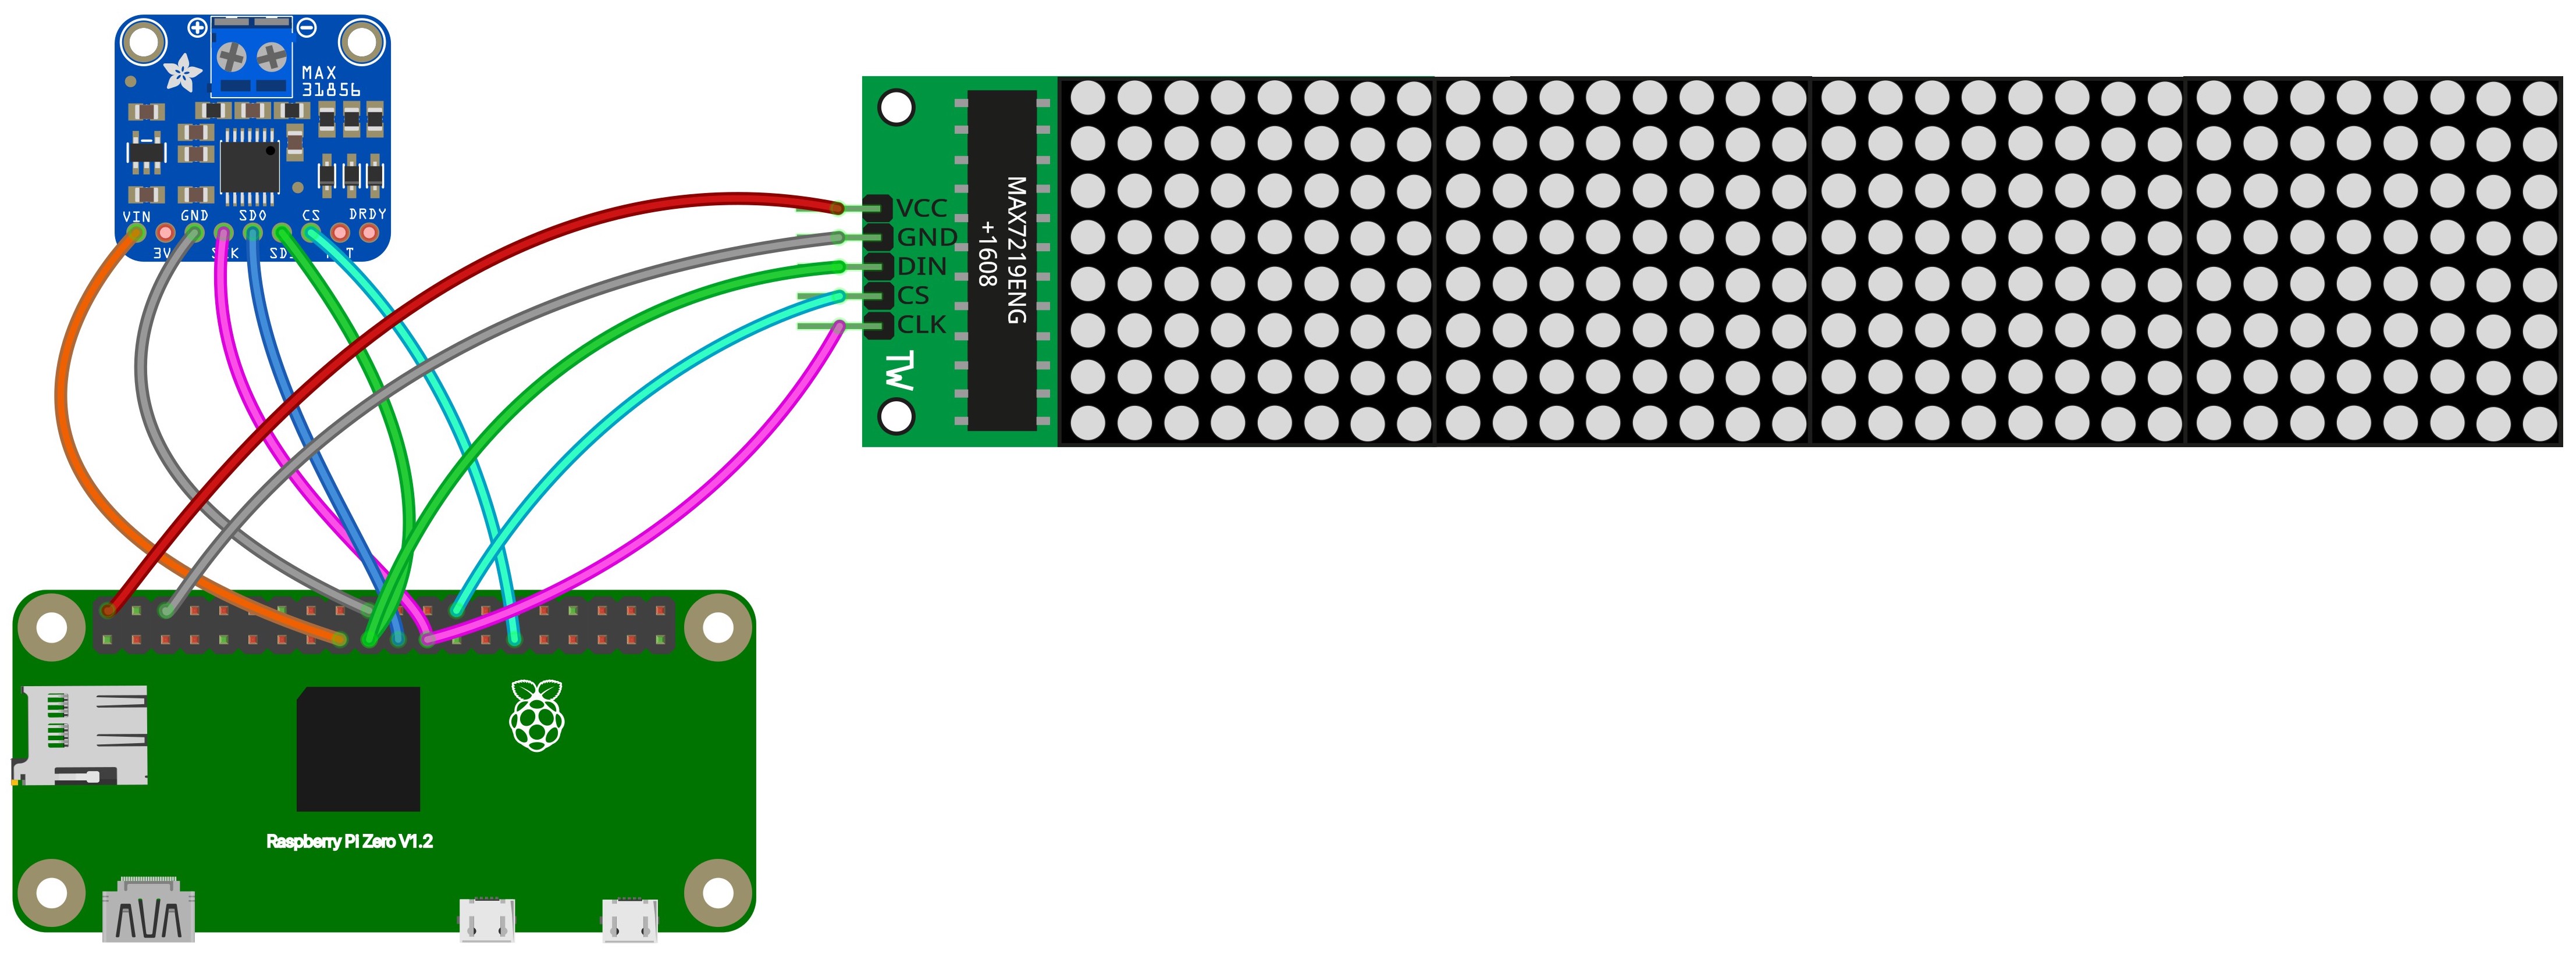
Wiring
Writing two SPI devices gets a little convoluted. Two of the Raspberry Pi GPIO pins are shared by the two devices (SPI clock and peripheral in). For these two pins, I made “Y” wires by soldering two wires to a single wire. The two ends go to the two devices, while the single end goes to the Raspberry Pi. The rest of the wires are not shared. The thermocouple breakout board is run at 3.3v and the LED matrix is run at 5v. The two devices can be wired to two separate ground pins on the GPIO. The two SPI chip select (CS) pins go to GPIO 8 and 7 by default. However, for whatever reason I was not able to get the thermocouple breakout board to run on any pin but the default adafruit library pin GPIO 5, even after changing the designated pin in the software with cs = digitalio.DigitalInOut(board.D5). GPIO 5 seems to work fine though, so I left it. Finally, the thermocouple board has an additional SPI peripheral out pin because it sends data back to the Raspberry Pi (the LED matrix only receives data).
Software
Here is a repo with all the code used in this project
Library descriptions and installation
First, the Adafruit CircuitPython MAX31856 library drives the thermocouple board. This library is well maintained and easy to use. To install the library:
pip3 install adafruit-circuitpython-max31856
I used Luma.LED_Matrix to control the display. This library can control several types of common LED displays and has functionality way beyond what I use here. Installation includes some dependencies and the authors recommend updating pip on the Raspberry Pi:
sudo usermod -a -G spi,gpio pi
sudo apt install build-essential python3-dev python3-pip libfreetype6-dev libjpeg-dev libopenjp2-7 libtiff5
sudo -H pip install --upgrade --ignore-installed pip setuptools
sudo python3 -m pip install --upgrade luma.led_matrix
I used gspread to upload the data to Google Sheets. Make sure you set up a Google service account and add the API key to your Raspberry Pi as described in a previous post and in the gspread documentation. I’ve written the script to read Google sheet URLs located in the url directory of the repo, you can see an example there. To install gspread:
pip install gspread
Finally, the freezer alarm system uses gspread_pandas to read the sensor data from Google Sheets and yagmail to send the email alerts. Both gspread_pandas and yagmail need API keys to work with Google, so maybe sure to read their documentation and set them up as the authors recommend.
Code overview
There are two main scripts that make up the system. The first script, read_freezer_thermocouple.py, controls the thermocouple and display. The script reads the thermocouple, updates the display to show the reading, then uploads the reading to a Google sheet. The script updates the displayed temperature every three seconds, but only uploads data to the Google sheet every three minutes. I set up the script to run automatically when the Raspberry Pi is turned on using systemd. I’ve written more about systemd in this post, but in short, to set up the service run these commands:
sudo cp /home/pi/git/Raspberry_Pi_freezer_sensor_blog_post/service/freezer.service /etc/systemd/system/
sudo systemctl enable freezer.service
The second script, freezer_alarm.py watches the Google sheet containing the freezer temperature readings. I run this script from a separate computer in case I lose power to the freezer, which is on the same circuit as the Raspberry Pi that monitors it. This script can be run from anywhere with an internet connection because it uses the Google sheet created by read_freezer_thermocouple.py. The script downloads the sheet and calculates the average temperature over the most recent 10 minute interval. If the temperature is above -65 ºC and it has been more than 30 minutes since the last alarm, the script emails an alarm to every email address on a second Google sheet. This allows alarm recipients to be easily edited by anyone in the lab. The script will also send out a separate alarm email if no new data has been sent to the Google sheet in the past 30 minutes, indicating a sensor failure or power outage. I run the script every 2 minutes with cron using the following crontab:
*/2 * * * * python3 /home/cedar/git/Raspberry_Pi_freezer_sensor_blog_post/python/freezer_alarm.py >> ~/.cron_log.txt 2>&1
An optional third script, trim_google_sheets.py, keeps the Google sheet at a manageable length for the R Shiny app described below. If the sheet is not trimmed, it continues to grow in size as the sensor runs, eventually slowing down the app. I made an optional workaround solution that uploads the data to three Google sheets, one with all the data, one with the past 30 days, and one with the past 7 days. The Shiny app only reads the data from the past 7 day sheet, keeping things relatively fast. trim_google_sheets.py trims the sheets so that they are the proper length. The sheet urls are read in by both read_freezer_thermocouple.py and trim_google_sheets.py from the url directory in the following tab-separated format, where the strings of characters are each sheet’s unique id (found in the sheet’s url between the last two slashes):
all	1PTW1-y7jl3w4oL8Hdp_pLoetTxZ0kBCYqSxjU1W_Hm8
week	1KpIEUuMpRD8q3DDNNUeJ1BqSztl_nAzA8DWtdTHFnVY
month	1_HbyPLVbzkS-GPMJ0nYEyBJogZneVJrzzAQgygPMeoY
pin	4
name	freezer_1
I run trim_google_sheets.py once a day with cron using the following crontab line:
0 23 * * * python3 /home/pi/git/Raspberry_Pi_freezer_sensor_blog_post/python/trim_google_sheets.py > ~/.cron_log.txt 2>&1
Hacky display fix
I’ve noticed a small problem with my MAX7219 LED matrix display: once every few days, some of the pixels with become stuck in the on or off position. While there is probably some way to clear the screen with software, I’ve decided to take the classic approach of turning it off and back on again a couple times each day with the following crontab line:
0 */12 * * * /sbin/shutdown -r now
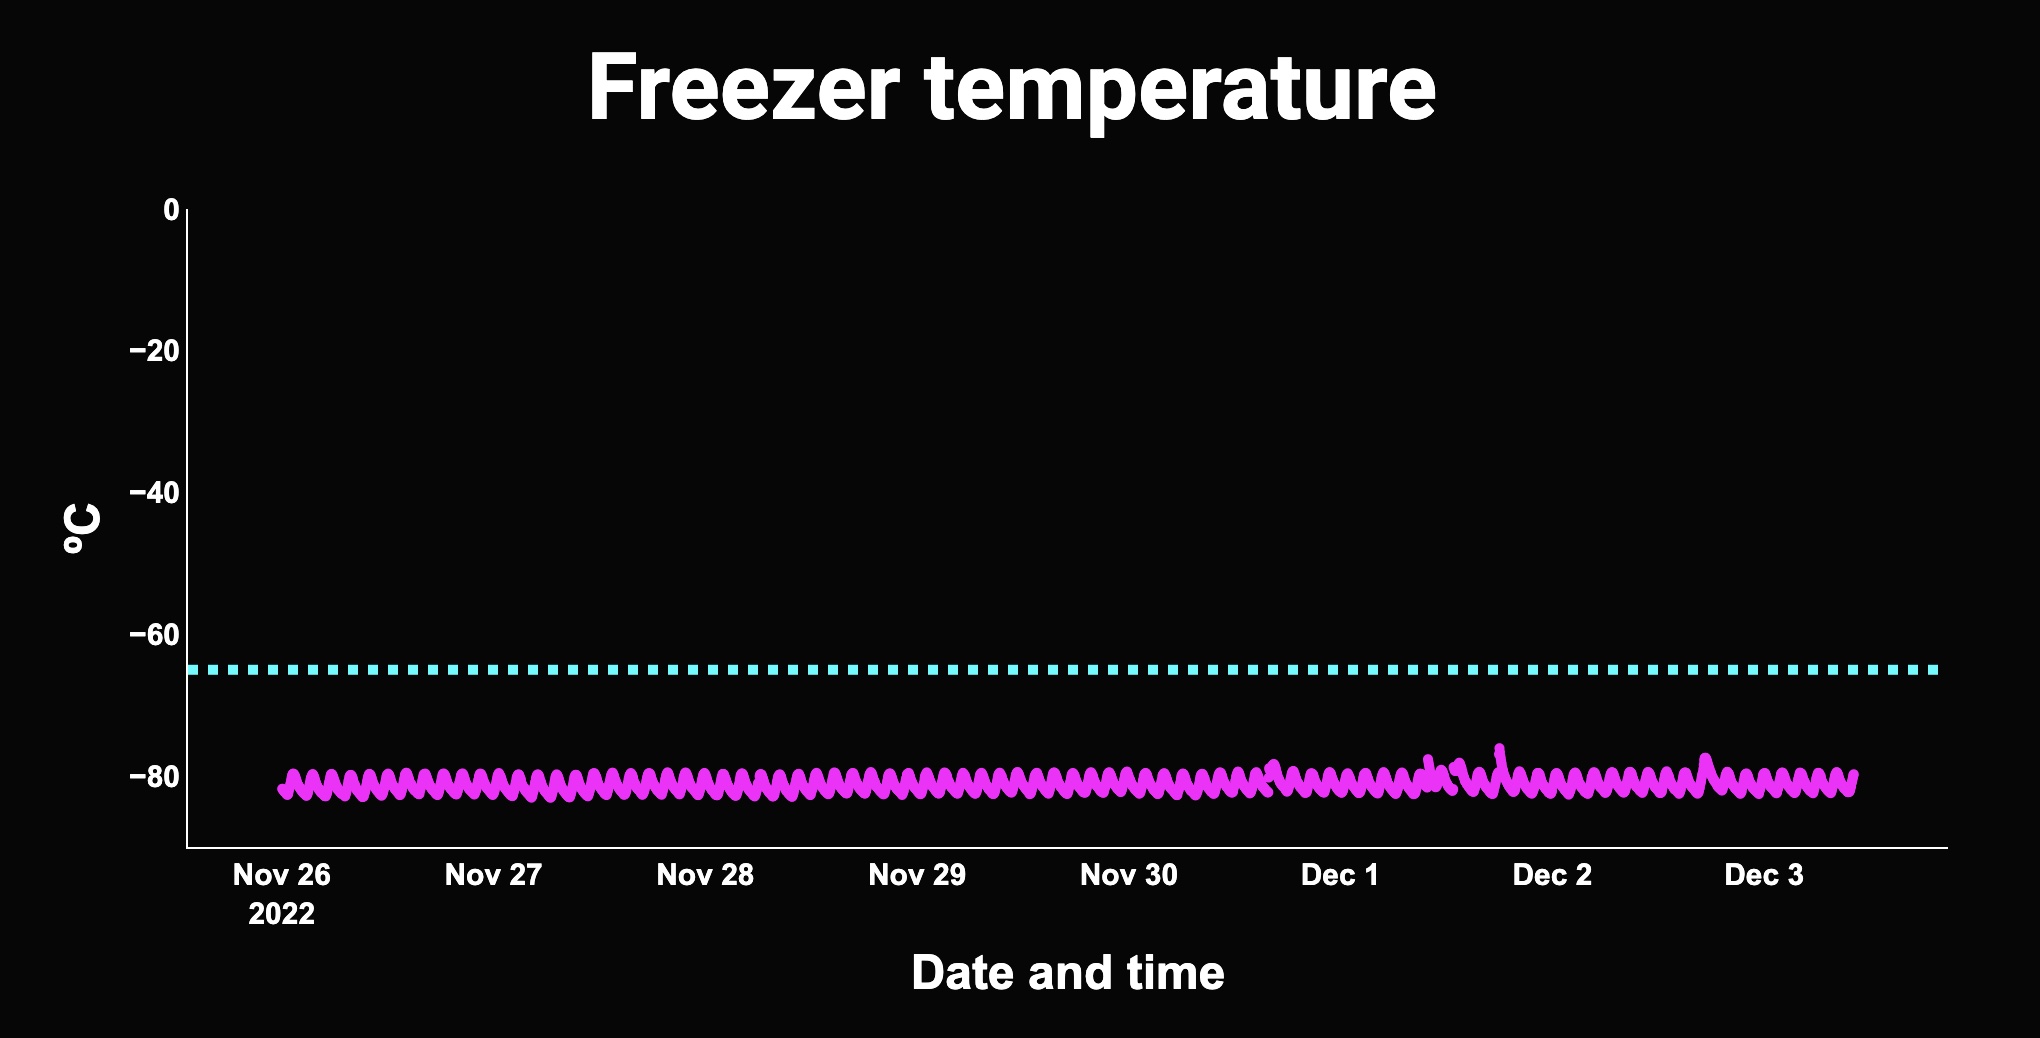
Monitor remotely with R Shiny app
I like to check in on the freezer, so I made a simply R Shiny app to visualize the data remotely. The app imports the data from the Google sheet and makes an interactive plot with Plotly. You can try out the app here, and I’ve included all the code I used to make it in the repo linked above.
Conclusion
Hopefully this post inspires you to use cheap hardware and freely available software tools to monitor your lab equipment. It might also convince you of the value in paying a company to do it for you. Doing it yourself can be a labor of love, but is also be pretty fun. Please feel free to reach out if you actually attempt this!
A note about Raspberry Pi shortages
As of this writing, it is very hard to buy a Raspberry Pi. I was lucky to have a several before the shortages started, but the ongoing problems are making me start to seriously consider alternative single-board computers. Right now the best way to get a Raspberry Pi is to use this website and Twitter page, where restocks are automatically tracked and posted.